A measured scaling benchmark
The fixed 10 kg hinge fails the primary prediction screen on PanTHERIA; data, exclusions, code and sensitivities are public in this release.
The primary result does not favor the hinge
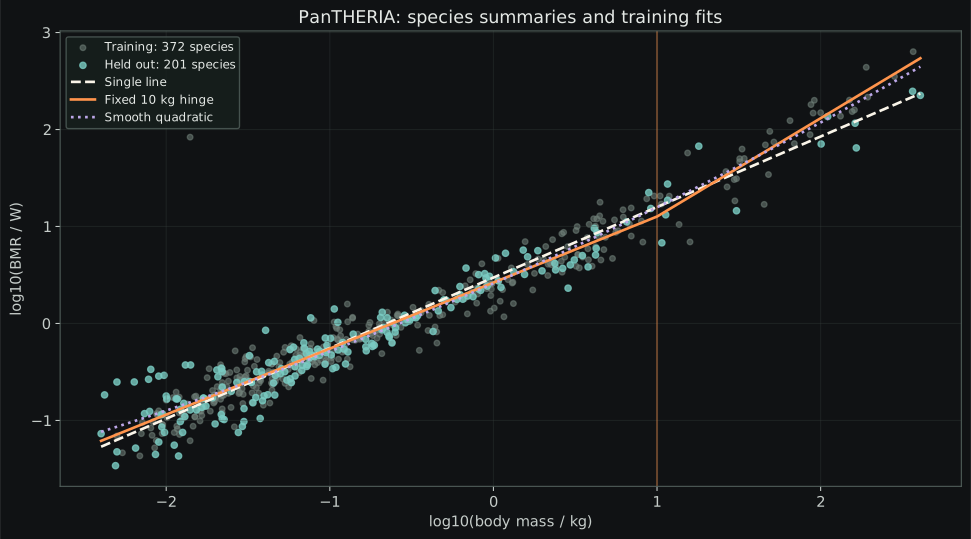
573 species, 99 families; 201 species in 30 families held out. A fixed 10 kg hinge has 1.20% worse test RMSE than the single-line baseline. The declared descriptive screen fails. This is a retrospective reanalysis of external measurements, not a new NetPhysics experiment or a registered confirmation.
| Model | Held-out RMSE, log₁₀ W | Training AICc | Training AICc weight |
|---|---|---|---|
| Single line | 0.198095 | -65.7497 | 0.000000154 |
| 10 kg hinge | 0.200464 | -95.2869 | 0.400578427 |
| Smooth quadratic | 0.195600 | -90.9936 | 0.046817523 |
| 20 kg hinge — sensitivity | 0.203100 | -95.9304 | 0.552603896 |
The better training fit does not carry through to the primary holdout. AICc is a training-only, independent-error approximation; related species limit its interpretation. It is not a probability that a physical mechanism is true. The weights normalize across these four alternatives, including the 20 kg sensitivity model; they are not held-out scores. They were already in the archived JSON and are now visible here. No result has changed.
Uncertainty and sensitivity remain visible
The 2,000-family-bootstrap 95% interval for MSE(single) − MSE(10 kg hinge) is [−0.009464, 0.009020] dex². Training and test families are separately resampled, with refitting. A positive fitted slope change does not by itself establish better prediction.
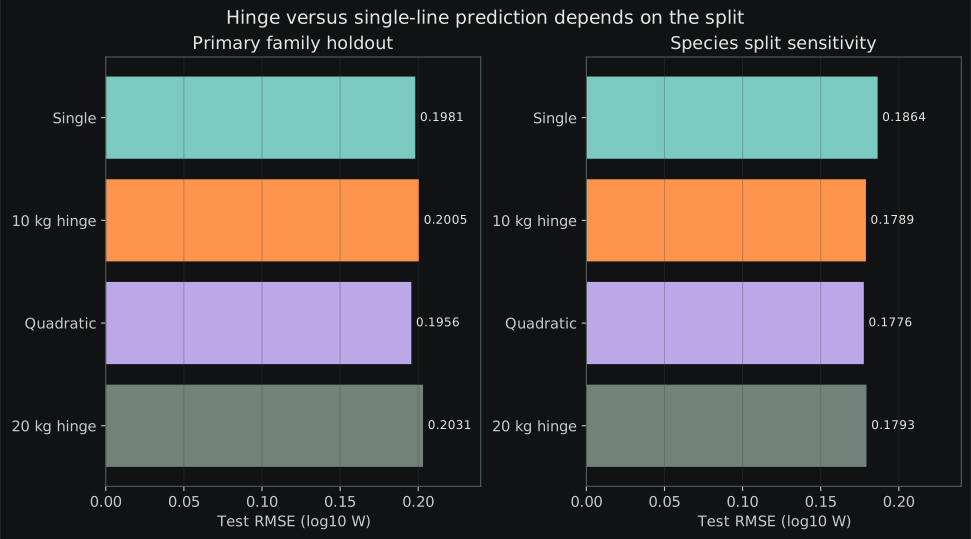
| Analysis | Single-line RMSE | 10 kg hinge RMSE | Scope |
|---|---|---|---|
| Primary family holdout | 0.198095 | 0.200464 | Disjoint families; primary comparison |
| Species split sensitivity | 0.186414 | 0.178941 | Related families can occur on both sides |
| Five-fold family CV | 0.216684 | 0.211003 | All 573 species; not another untouched test set |
Five-fold CV gives a modest 2.62% hinge improvement, below the 5% screen. Split dependence is a limitation. Additive raw-watt fits also remain available; their error target differs from log-scale fits.
What was actually measured?
PanTHERIA compiles measurements from many studies. We use positive BMR-associated mass and BMR values: 573 of 5,416 original rows. Every excluded row has a reason. BMR and mass are separate species medians, not paired individual measurements. The original publisher archive checksum was verified.
Mass is converted from grams to kilograms and oxygen consumption from mL/hour to watts using a fixed 20.1 J/mL assumption. This constant does not change fitted slopes. Family blocking is not PGLS; temperature, source methods and measurement uncertainty remain unresolved. Audit overlap before calling another compilation independent replication.
Reproduce and inspect
Full methods and result report · Local analysis specification · Source provenance
All results · 573 included species · 4,843 exclusions · Held-out predictions
Analysis source · Reproduction commands · Complete research archive
python metabolic.py
python protocol_tools.py
python check_invariants.py
python make_figures.py
No empirical result here establishes a universal breakpoint, a new law, or the absence of all curvature. Dodds et al. motivates a candidate crossover; Kolokotrones et al. motivates smooth curvature as an alternative.
Error-model clarification / 0.6.0
Xiao et al. and Leitão et al. sharpen the likelihood assumptions. Raw- and log-response information criteria require a common response measure with the Jacobian. The published primary result is unchanged.