Look inside
Compare published snapshots and turn a conceptual crystal cutaway.
Explore the evidence ↓A material’s internal arrangement can matter as much as its ingredients.
Researchers have mapped broad boundary regions inside a copper-based superconductor. For NetPhysics, the useful next question is precise: can measured geometry improve predictions of a material’s response?
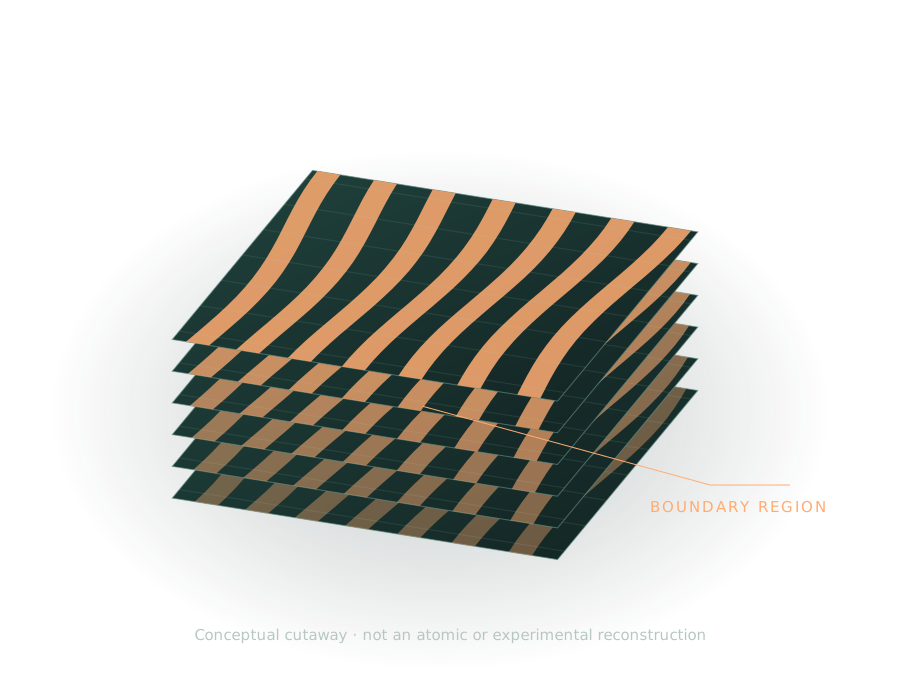
Ladbrook, Wright and Senn used scanning 3D X-ray diffraction to investigate La1.675Eu0.2Sr0.125CuO4 (LESCO), a member of the 214 cuprate family.
At 300 K, extended tetragonal-like regions separate orthorhombic twin domains. Their reported width is about 150 nm, with separations of roughly 0.5–2 μm. Cooling changes the structural pattern.
300 K — Extended near-tetragonal regions lie within an orthorhombic twin pattern.
These are discrete published snapshots. The buttons do not simulate a temperature sweep. The colors represent the paper’s signed orthorhombic strain measure; the original legend is in the full figure.
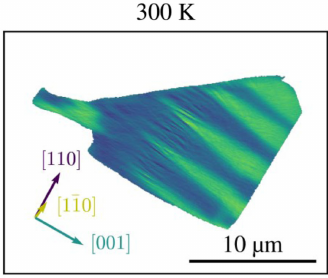
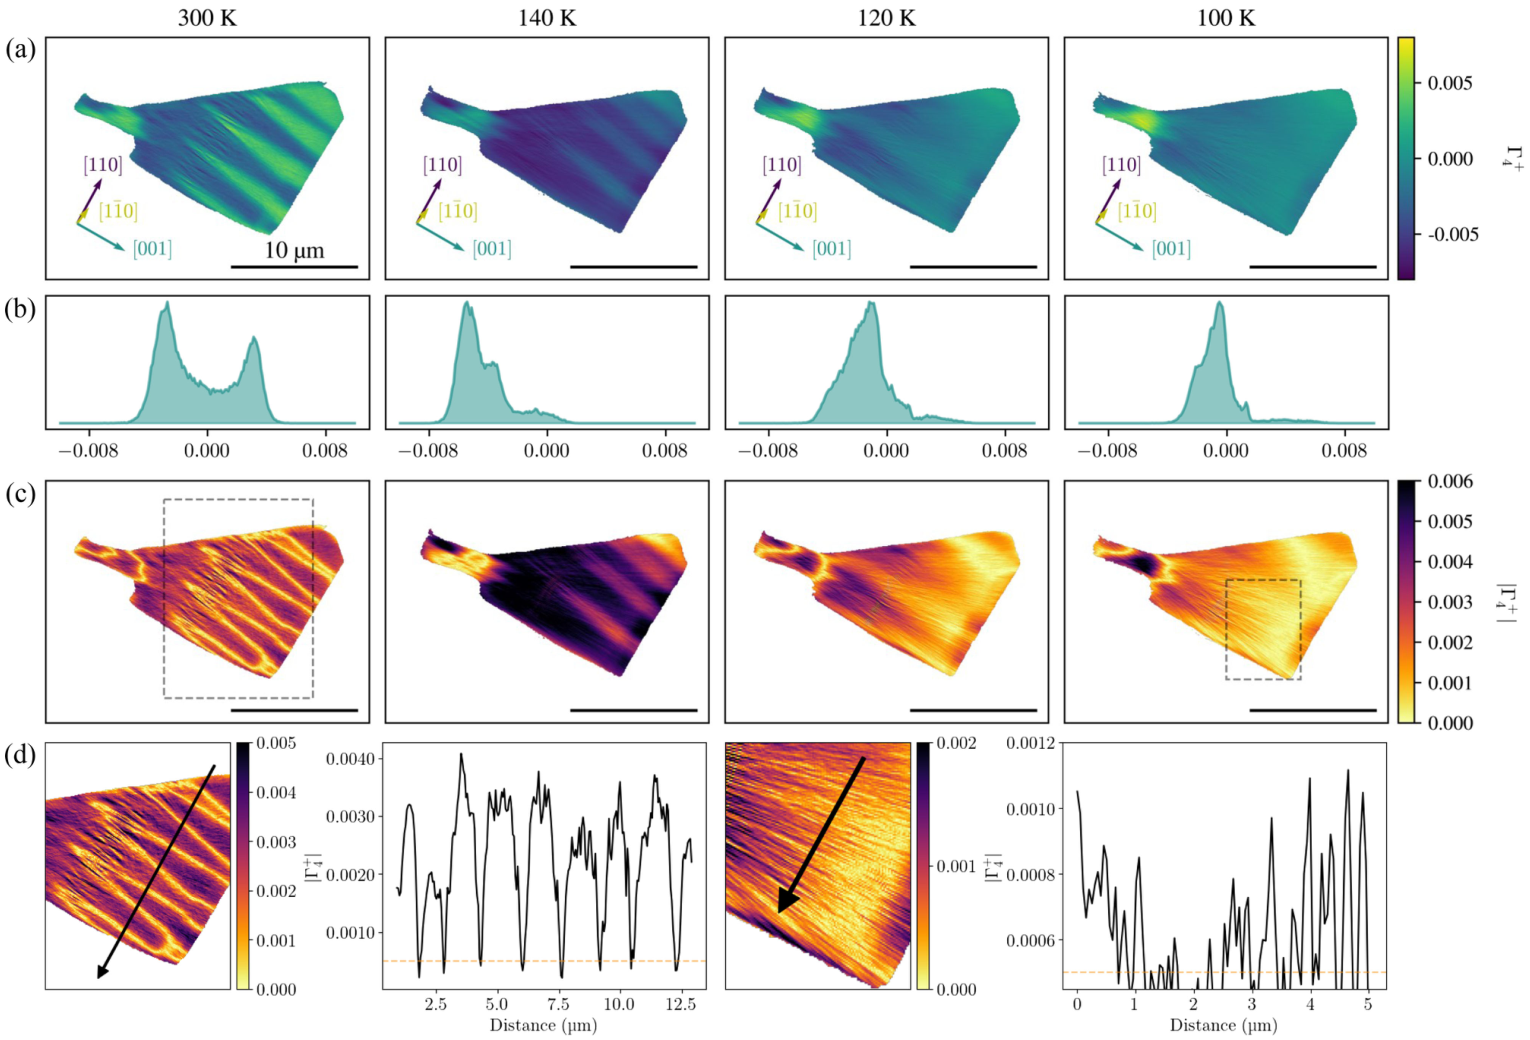
Evie Ladbrook, Jon P. Wright and Mark S. Senn, “Giant Domain Walls and Intrinsic Heterogeneity in 214 Cuprate Superconductors,” Physical Review Letters 137, 126504 (2026). DOI: 10.1103/r62x-kt5j. CC BY 4.0. Extracted from published figure 2; temperature images are crops of panel (a). Original map colors and scale bars retained.
The study establishes structural organization. It does not directly measure the local superconducting response at every boundary, and it does not validate the NetPhysics framework.
A broad transition region occupies space. Its width, orientation and connections can matter. That makes internal geometry a measurable input to a model, rather than merely an illustration.
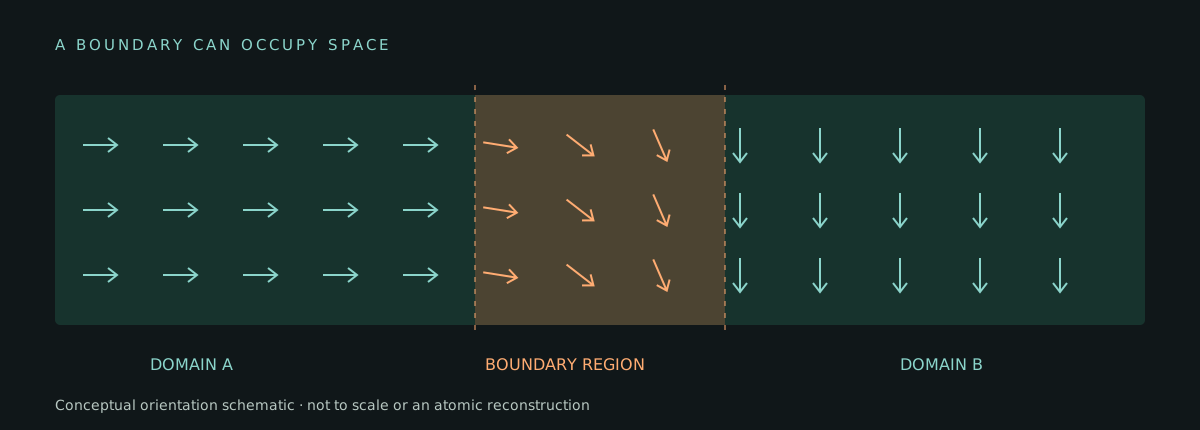
Conceptual orientation schematic, not an atomic reconstruction; not to scale.
Structural heterogeneity in cuprates was already known. This work adds a three-dimensional picture of unusually broad regions and their organization. Whether they frustrate coherence or support particular local pathways requires electronic measurements and material-specific theory.
Compare published snapshots and turn a conceptual crystal cutaway.
Explore the evidence ↓Control boundary direction, width, gaps and conductivity in an ordinary conduction model.
Open tool →Threshold a numeric grid, inspect connected regions and measure a transect.
Open tool →Compare supplied predictions against two baselines on independent test specimens.
Open tool →A silent, captioned film connects the published result to the work that comes next.
Download the film (MP4) · Original conceptual animation and model results; published figure crop credited below.
0–12 seconds: A crystal can look uniform from the outside. Look inside, and structure becomes part of the question.
12–24 seconds: X-rays reveal a textured interior. Ladbrook and colleagues report boundary regions about 150 nm wide in a 214 cuprate. Structural mapping does not by itself establish the local electronic consequence.
24–36 seconds: Change the arrangement. In this ordinary conduction model, the same fraction of less-conducting material gives different responses when bands run across or along the applied field. This is an illustration, not a prediction of superconductivity.
36–48 seconds: Measure the structure. Freeze the prediction. Test new specimens. Can measured geometry improve predictions beyond established models?
Evie Ladbrook, Jon P. Wright and Mark S. Senn, “Giant Domain Walls and Intrinsic Heterogeneity in 214 Cuprate Superconductors,” Physical Review Letters 137, 126504 (2026). DOI: 10.1103/r62x-kt5j. CC BY 4.0. Extracted from published figure 2; temperature images are crops of panel (a). Original map colors and scale bars retained.
Collect structural maps and electronic measurements on the same specimens. Compare a geometry-informed candidate with a uniform baseline and a strong conventional model. Freeze all predictions before opening the held-out outcomes.
Design the comparison →Test different preparation histories at matched final conditions. A history-dependent response would require its own controls and conventional explanations. This paper does not demonstrate physical memory.
Read the limits →